Feeling a little sluggish?
Most performance issues aren’t what they seem. This tool makes latency visible, directly inside FileMaker.
Diagnosing Performance Inside FileMaker
This diagnostic runs directly inside FileMaker, providing immediate latency feedback without external tools.
When users report “performance issues,” they’re rarely describing the actual problem.
It usually sounds like:
- “It feels slow”
- “Uploads take too long”
- “The system is lagging”
In most cases, the issue is latency. Not throughput. Not system load.
The challenge is that diagnosing this typically requires:
- Open Terminal
- Run ping, curl, or traceroute
- Interpret results
That’s not something most FileMaker users or clients are comfortable doing.
Latency Expectations
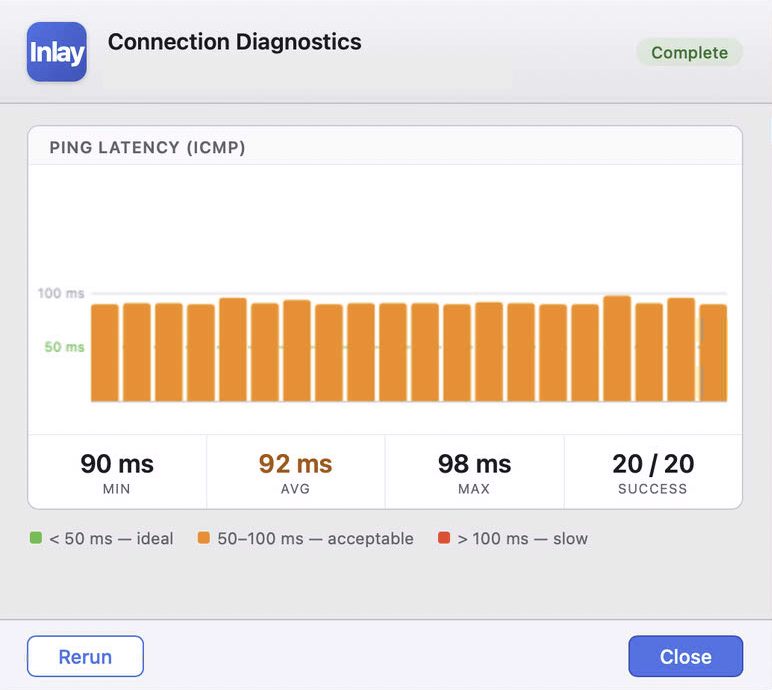
Claris FileMaker recommends keeping client-to-server latency below 50ms for optimal performance.
- < 50ms → ideal (recommended by Claris)
- 50–100ms → acceptable, may feel slower
-
100ms → degraded experience
As latency increases, FileMaker interactions become noticeably less responsive due to frequent client-server round trips.
The Gap
FileMaker sits at the center of the workflow, but has no native visibility into network conditions.
So when something feels slow, you’re left guessing:
- Is it the client machine?
- The network?
- The FileMaker Server?
- Is it my Layout of script steps?
Without data, everything becomes speculation. And speculation leads to the wrong fixes.
Inlay_CONNECTION_DIAG measures round-trip latency to a target endpoint and returns structured results directly to FileMaker.
Have questions about this or an idea for Inlay?
Get in touch →